Tutorial 1: Climate Change Impact Prediction Using ANN Model
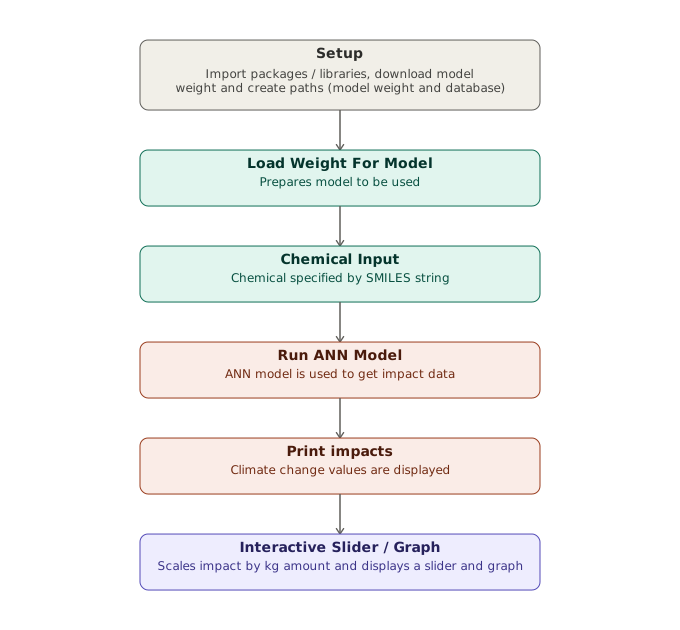
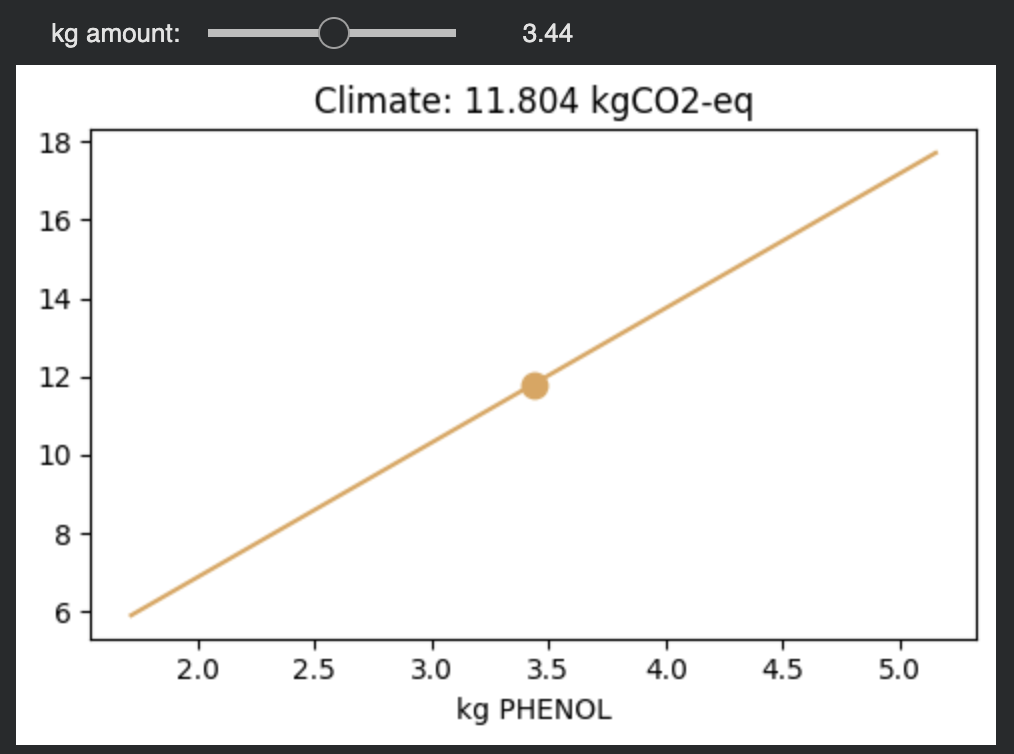
In this code you will be able to estimate the impact to Climate Change using the ANN Model. Then you will be able to see how changing the amount of that chemical will affect the predicted impact.
Code Overview:
This code will download the climate change impact weight of a pre-trained Artificial Neural Network (ANN) model locally and give this file to the code, which then will take the input of a chemical using the SMILES identification to tell you the impact to climate change in kg CO2 equivalent per kg of chemical. Then you will be able to see the impact scaled according to how much mass in kg you have of that chemical.
The libraries / packages listed in cell 1 will have a brief explanation of their function in the code, but for more information, please use the links below
| Library / Package | Link to Documentation |
|---|---|
| numpy | NumPy Documentation |
| pandas | Pandas Documentation |
| matplotlib.pyplot | Matplotlib.pyplot |
| ipywidgets | Jupyter Widgets |
| IPython.display | Display Module |
| tensorflow | Tensorflow |
| os | OS |
| requests | Requests |
Click the button below to open this code in Google Colab

Outputs Should Appear Like This:
# Cell 1: Import Required Libraries / Packages

import numpy as np                    # Stores numbers in arrays and runs fast calculations on them
import pandas as pd                   # Opens the data file as a table and find rows by their SMILES string
import matplotlib.pyplot as plt       # Plot Graphs
import ipywidgets as widgets          # Creates UI elements such as the slider below
from IPython.display import display   # Displays UI elements

import tensorflow as tf               # Loads the trained neural network (ANN) and runs it to make predictions

import os                             # Allows interactions with the file system
import requests                       # Makes requests to internet files

import joblib                         # Parallel Computing
# Cell 2: Define Function to Download Weight (.h5 file) of ANN Model
def download_if_needed(url, local_path):
"""Download a file from GitHub if it doesn't already exist."""
if os.path.exists(local_path):
print(f"✓ Using existing {local_path}")
return
print(f"Downloading {local_path}...")
response = requests.get(url)
response.raise_for_status()
with open(local_path, "wb") as f:
f.write(response.content)
print("Download complete.")# Cell 3: Create Path to Dowloaded File (Weight) and Database
# URL / path to download (.h5 file)
CC_MODEL_URL = ("https://raw.githubusercontent.com/cacherowan/CACHE-Rowan/main/Reference_Files/Chemical_Property_Database/model_v5_CC_okayvaltest.h5")
# Name of weight file
CC_MODEL_PATH = "model_v5_CC_okayvaltest.h5"
# URL / path to download (.joblib file)
MIN_MAX_SCALAR_URL = ("https://raw.githubusercontent.com/cacherowan/CACHE-Rowan/main/Reference_Files/Chemical_Property_Database/minmax_scaler_0_5-1.joblib")
# Name of min_max_scalar file
MIN_MAX_SCALAR_PATH = "minmax_scaler_0_5-1.joblib"
# URL / path to database (the spreadsheet holding the molecular properties)
DATABASE_PATH = "https://raw.githubusercontent.com/cacherowan/CACHE-Rowan/main/Reference_Files/Chemical_Property_Database/Processed_Solvent_DF_v6_TEST.xlsx"
# Call to Function to Download Weight (.h5 file)
download_if_needed(CC_MODEL_URL, CC_MODEL_PATH)
# Call to Function to Download Min Max Scalar
download_if_needed(MIN_MAX_SCALAR_URL, MIN_MAX_SCALAR_PATH)
# The trained model file (.h5) that predicts Climate Change Impact
CC_MODEL = CC_MODEL_PATH
# Min Max Scalar
Min_Max_Scalar = MIN_MAX_SCALAR_PATHExpected output
Downloading model_v5_CC_okayvaltest.h5...
Download complete.
Downloading minmax_scaler_0_5-1.joblib...
Download complete.
# Cell 4: Load the trained model
# Load the .h5 file, which contains the trained network: its structure and its learned weights.
# This rebuilds the model as "model_CC," ready to make predictions.
# compile=false in the code below helps skip the training setup, since we are only using the model to predict (not train it).
import warnings
warnings.filterwarnings("ignore")
model_CC = tf.keras.models.load_model(
CC_MODEL_PATH,
custom_objects={"LeakyReLU": tf.keras.layers.LeakyReLU},
compile=False
)# Cell 5: Load the molecule database
# Opens the spreadshet into a table, and uses each molecule's SMILES code as its row name so molecules are easy to look up
db = pd.read_excel(DATABASE_PATH)
db = db.set_index('SMILES')# Cell 6: Select the thermodynamic properties and the molecular descriptors used as inputs for the Climate Change model
# The Climate Change model was trained on a specific set of 10 features.
# We must feed the model the exact same features, in the exact same order, every time we ask it to make a prediction.
# Thermodynamic properties:
thermo_feat_CC = [
'Heat Capacity (kJ/kgC)', # heat needed to raise the temperature of the molecule
'Boiling Point(K)', # temperature at which it boils
'XLogP', # a measure of how "fat-loving" vs "water-loving" a molecule is
'Critical Temperature [K]', # temperature above which it can't be liquefied
'Critical Molar Volume [m3/mol]' # volume one mole occupies at the critical point
]
# Molecular descriptors:
mol_desc_feat_CC = [
'BertzCT', # a measure of molecular complexity
'ExactMolWt', # exact molecular weight
'HallKierAlpha', # a shape-related descriptor
'PEOE_VSA6', # surface-area descriptor related to partial charges
'NOCount' # count of Nitrogen and Oxygen atoms
]# Cell 7: Load the scaler
scaler = joblib.load(Min_Max_Scalar)
feature_names = list(scaler.feature_names_in_)
data_min = scaler.data_min_
data_max = scaler.data_max_
lo, hi = scaler.feature_range
def scale_subset(values):
"""Apply the fitted MinMax scaler to a subset of columns, by name."""
scaled_values = []
for feature_name in values.index:
if feature_name not in feature_names:
print(f"Warning: '{feature_name}' was not seen by the scaler at fit time.")
continue
# Find where this feature is in the scaler's arrays
position = feature_names.index(feature_name)
x = values[feature_name]
x_min = data_min[position]
x_max = data_max[position]
# MinMax formula: rescale x from [x_min, x_max] to [lo, hi]
x_scaled = (x - x_min) / (x_max - x_min) * (hi - lo) + lo
scaled_values.append(x_scaled)
return pd.Series(scaled_values, index=values.index)# Cell 8: Predict Climate Change impact for one molecule (Build Prediction Function)
# This function takes a molecule, looks up its properties in the database, feeds them to the trained model, and returns the predicted Climate Change Impact (kg CO2-eq per kg of chemical).
# Run this cell once. It won't show any output on its own, it just sets up the function so the cells below can use it.
def predict_climate_change_impact(molecule_name, smiles):
"""
Predict the Climate Change Impact of one molecule.
molecule_name : name for printing only (e.g. "Methanol") — doesn't affect the result.
smiles : SMILES string; must exactly match a row in the database.
Returns the predicted impact in kg CO2-eq per kg of chemical.
"""
descriptors = db.loc[smiles]
descriptors_cc = descriptors.loc[thermo_feat_CC + mol_desc_feat_CC]
descriptors_cc_scaled = scale_subset(descriptors_cc)
# Show the feature values that go into the model for this molecule.
print(f"\nFeatures for {molecule_name} ({smiles}):")
for feature_name, value in descriptors_cc.items():
print(f" {feature_name}: {value}")
model_input = np.array([list(descriptors_cc_scaled)])
prediction = model_CC.predict(model_input, verbose=0)
impact_value = prediction.item()
print(f"Climate Change Impact of {molecule_name}: "
f"{round(impact_value, 4)} kgCO2-eq/kg {molecule_name}")
return impact_value# Cell 9: Calculate the Climate Change Impact of a chemical
# Give the function below two things: the chemical's name (for display) and its SMILES code, which the model uses to look it up. Run the cell to see its features and its predicted climate change impact.
# To calculate the impact for another chemical, copy the line below into a new cell and change the name and SMILES.
predict_climate_change_impact("Methanol", "CO");Expected output
Features for Methanol (CO):
   Heat Capacity (kJ/kgC): 2.5318
   Boiling Point(K): 337.85
   XLogP: -0.5
   Critical Temperature [K]: 512.5
   Critical Molar Volume [m3/mol]: 0.000117
   BertzCT: 2.0
   ExactMolWt: 32.026214748
   HallKierAlpha: -0.04
   PEOE_VSA6: 0.0
   NOCount: 1
Climate Change Impact of Methanol: 0.6325 kgCO2-eq/kg Methanol
# Cell 10: Example with Ethanol
predict_climate_change_impact("Ethanol", "CCO");Expected output
Features for Ethanol (CCO):
   Heat Capacity (kJ/kgC): 2.57
   Boiling Point(K): 351.35
   XLogP: -0.1
   Critical Temperature [K]: 514.0
   Critical Molar Volume [m3/mol]: 0.000168
   BertzCT: 2.754887502163468
   ExactMolWt: 46.041864812
   HallKierAlpha: -0.04
   PEOE_VSA6: 0.0
   NOCount: 1
Climate Change Impact of Ethanol: 2.3695 kgCO2-eq/kg Ethanol
# Cell 11: Example with Benzene
predict_climate_change_impact("Benzene", "c1ccccc1");Expected output
Features for Benzene (c1ccccc1):
   Heat Capacity (kJ/kgC): 1.7469
   Boiling Point(K): 353.24
   XLogP: 2.1
   Critical Temperature [K]: 562.05
   Critical Molar Volume [m3/mol]: 0.000256
   BertzCT: 71.96100505779535
   ExactMolWt: 78.046950192
   HallKierAlpha: -0.78
   PEOE_VSA6: 36.39820241076966
   NOCount: 0
Climate Change Impact of Benzene: 1.6787 kgCO2-eq/kg Benzene
# Cell 12: Example with Toluene
predict_climate_change_impact("Toluene", "Cc1ccccc1");Expected output
Features for Toluene (Cc1ccccc1):
   Heat Capacity (kJ/kgC): 1.719
   Boiling Point(K): 383.75
   XLogP: 2.7
   Critical Temperature [K]: 591.75
   Critical Molar Volume [m3/mol]: 0.000316
   BertzCT: 129.9656602453383
   ExactMolWt: 92.062600256
   HallKierAlpha: -0.78
   PEOE_VSA6: 35.89528683400505
   NOCount: 0
Climate Change Impact of Toluene: 1.5449 kgCO2-eq/kg Toluene
# Cell 13: Example using Phenol (Which will be displayed later on a slider and graph)
# 1. Example: Phenol
MOLECULE = "PHENOL" # Change name to another molecule if needed (display only)
SMILES = "Oc1ccccc1" # Change SMILES to another molecule if needed (Required to change molecule)
impact_value_slider = predict_climate_change_impact(MOLECULE, SMILES)Expected output
Features for PHENOL (Oc1ccccc1):
   Heat Capacity (kJ/kgC): 2.1408
   Boiling Point(K): 454.99
   XLogP: 1.5
   Critical Temperature [K]: 694.25
   Critical Molar Volume [m3/mol]: 0.000229
   BertzCT: 134.1073696954145
   ExactMolWt: 94.041864812
   HallKierAlpha: -0.9800000000000001
   PEOE_VSA6: 18.19910120538483
   NOCount: 1
Climate Change Impact of PHENOL: 3.4357 kgCO2-eq/kg PHENOL
# Cell 14: Phenol Continued, Creating Slider to Visualize Impact
kg_slider = widgets.FloatSlider(value=(round(impact_value_slider, 4)), min=(round(impact_value_slider, 4)) * 0.5, max=(round(impact_value_slider, 4)) * 1.5, step=0.1, description='kg amount:')
output_slider = widgets.Output()
def update_slider(change):
with output_slider:
output_slider.clear_output()
kg_slider_kg = kg_slider.value
total_cc_slider = (round(impact_value_slider, 4)) * kg_slider_kg
print(f"Climate Impact: {total_cc_slider:.4f} kgCO2-eq")
kg_slider.observe(update_slider, names='value')
display(kg_slider, output_slider)
update_slider(None)Expected output

# Cell 15: Phenol Continued, Creating Slider and Graph to Visualize Impact

kg_slider_graph = widgets.FloatSlider(value=(round(impact_value_slider, 4)), min=(round(impact_value_slider, 4)) * 0.5, max=(round(impact_value_slider, 4)) * 1.5, step=0.1, description='kg amount:')
output_graph = widgets.Output()

cc_per_kg = (round(impact_value_slider, 4))
kg_range = np.linspace((round(impact_value_slider, 4)) * 0.5, (round(impact_value_slider, 4)) * 1.5, 20)

def update_graph(change):
    with output_graph:
        output_graph.clear_output(wait=True)
        kg_graph_kg = kg_slider_graph.value
        total_cc_graph = cc_per_kg * kg_graph_kg

        fig, ax = plt.subplots(figsize=(5, 3.5))

        ax.plot(kg_range, cc_per_kg * kg_range, color='#e0a458')
        ax.scatter([kg_graph_kg], [total_cc_graph], color='#e0a458', zorder=5, s=80)
        ax.set_title(f"Climate: {total_cc_graph:.3f} kgCO2-eq")
        ax.set_xlabel(f"kg {MOLECULE}")

        plt.tight_layout()
        plt.show()

kg_slider_graph.observe(update_graph, names='value')
display(kg_slider_graph, output_graph)
update_graph(None)
Expected output
Discussion / Analysis
In this code, you were able to see how a chemical impacts climate change using the ANN Model. Then you could see how changing the amount of that chemical affects the climate change impact prediction.